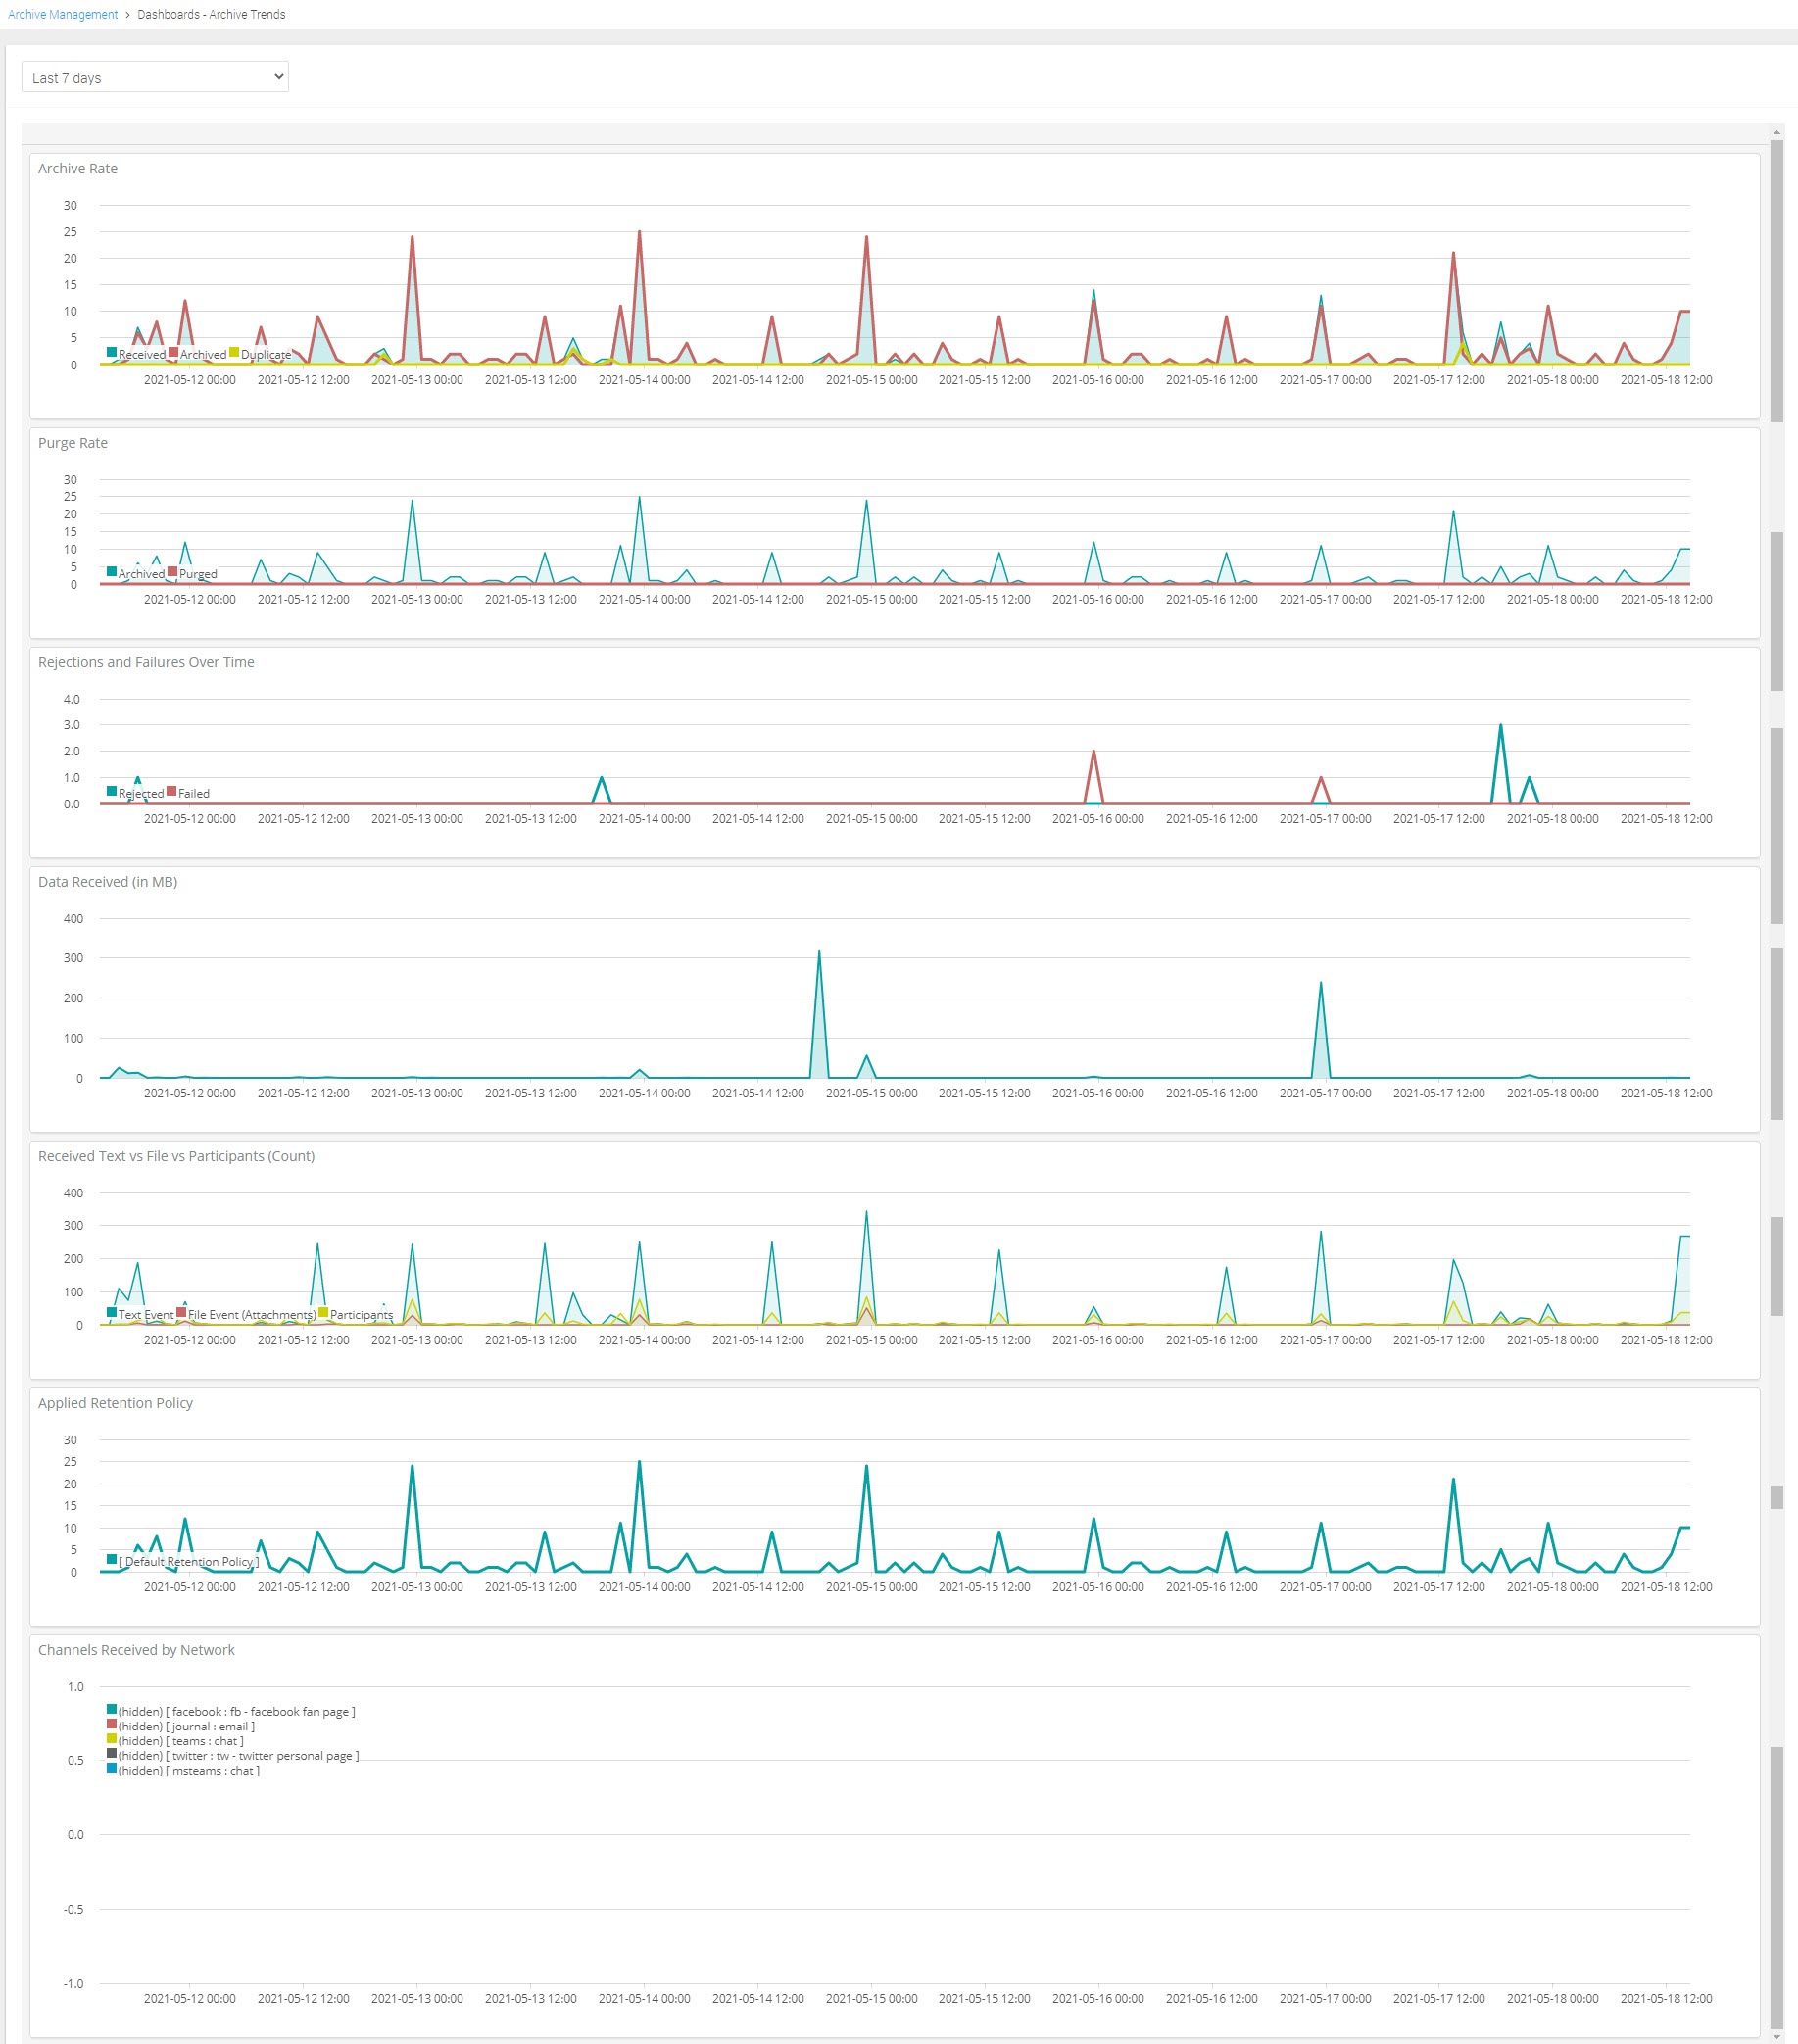
Archive Trends
Archive Trends dashboard contains the following visualizations that enables you to understand the trend at which communications are archived into Enterprise Archive.
User will require appropriate permission to access this dashboard. By default, the report displays the data for Last 7 days.
|
Visualization |
Definition |
|
Archive Rate |
Depicts the ingestion rate in comparison with the number of communications received against the number of communications Archived and Duplicated. |
|
Purge Rate |
Depicts the rate at which communications are purged in comparison with the number of communication archived. |
|
Rejections and Failures Over Time |
Depicts the rate/trend of communications that were identified as Rejected and Failed during ingestion in UTC time. The graph is shown based on the selected date range. |
|
Data Received (in MB) |
Depicts the overall rate/trend of communication received/ingested into Enterprise Archive. |
|
Received Text vs File vs Participants (Count) |
Depicts the rate/trend of communication ingested against the number of files (attachments) received and participant count. |
|
Applied Retention Policy |
Depicts the rate/trend of communications for which retention policy is applied. |
|
Channels Received by Network |
Depicts all the communication that were received and represented by the network they belong to. |