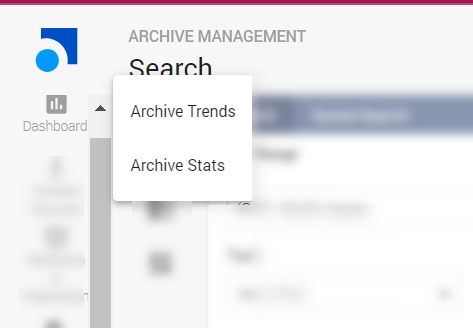
Archive Management Dashboards
Archive Management uses an Smarsh reporting framework, to analyze and represent data using various visualizations such as graphs, pie charts, and so on. The following Dashboards are available in Archive Management:
The visualization under each dashboard lists a compilation of the following point-in-time statistical data based on the Archive Management activities:
Data received at gateways and the archive
Data purged based on retention policies