Policy
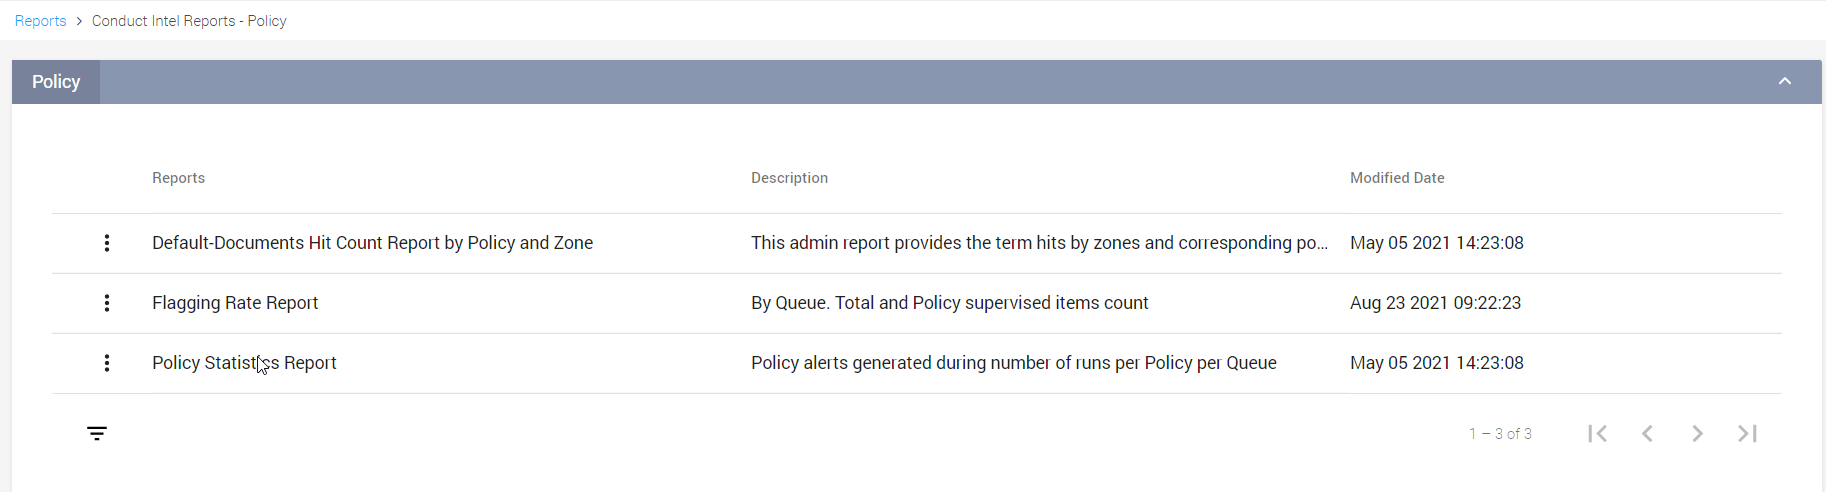
The Policy reports contains various Reports related to Conduct Policies present in all the Conduct Queues.
The following are the available Policy reports:
You can
Edit
these reports by clicking the vertical ellipse (
 ) beside each report. The columns icon (
 ) in the bottom-left corner enables you to hide or add desired columns to the page.
All these reports can be exported to a .CSV format by clicking the Export to CSV button. The info icon beside the export button displays the time zone and date-format used to generate the report.
You can also filter and view the report by choosing an appropriate timeline option from the drop-down menu available in the top-right corner above each report. By default, the report displays the data for Last 7 days. Using the Custom option allows you to specify a date range to filter the reports. By default, date range can be specified for the past 90 days. The default value of 90 days can be configured using a server property. Contact Smarsh Representative to configure the server property.
You can further filter the reports by using the available Filtering the Reports options.
Flagging Rate Report
This report enables the user to view the total number of items added to each Queue Vs. items added through a policy trigger, for the selected time and supervised participants.
The following details are available in the report:
|
Details |
Description |
|
Queue |
Name of the Queue being audited for each participant. |
|
Participants |
Name of the participant whose communications have matched the assigned Policies. |
|
Total Items |
Total number of matched communications for a particular participant. |
|
Total Policy Supervised Items |
Total number of matched Policies for the supervised participant. |
Policy Statistics Report
This report provides statistics on the number of times a policy has run and the total number of items matched in those runs. This report provides a view by Policy and Queue along with the total number of alerts (matched items) when a policy is run (Scheduled as well as On-Demand).
The following details are available in the report:
|
Details |
Description |
|
Policy Name |
Name of the Policy assigned to the Conduct Queue. |
|
Queue |
Name of the Queue. |
|
Alerts |
Total number of alerts generated (matched items) by the policy for the Conduct Queue. |
|
No. of Runs |
Total number of runs performed (Scheduled as well as On-Demand) by the policy for the Conduct Queue. |
Default - Documents Hit Count Report by Policy and Zone
This report provides the count of term hits by zones for the triggered policies, in their respective Queues.
To ensure accurate results are obtained for this report, the Run Now operation should always be performed from the previous day's data and not for the current day.
This report is based on the ROLLUP_DATE entry, which is the day of the scheduled rollup job. The scheduled rollup job runs once every 24 hours.
The following details are available in the report:
|
Details |
Description |
|
Queue |
Name of the Queue that is configured with the Lexicon Policy with the hit term. |
|
Policy |
Name of the Lexicon Policy that contains the hit term. |
|
Zone |
Zone in which the hit term appeared, such as body, subject, etc. |
|
Term Hit |
Terms hit for the supervised documents. |
|
Document Count |
Number of term hits by the policy against the supervised documents. |
Filtering the Reports
You can further filter the results based on the available data. To filter the report:
Double-click over one of the columns in the report. Based on the report and the column clicked, the filters appear on top of the report.
Figure 52: Report Filters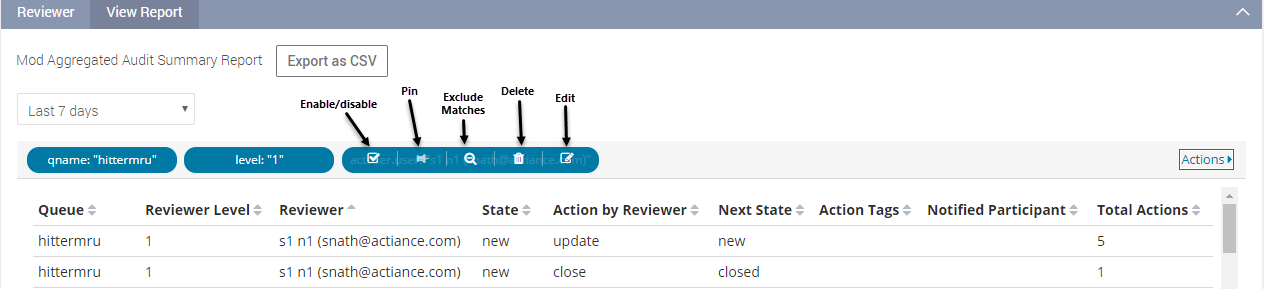
Disable the required filter.
Click Apply Now.
The report displays data based on the enabled filters. To remove the applied filter, you can either click Remove from the Actions drop-down or refresh the report.
Figure 53: Report Filter Actions
